Lecture Analysis


Graphic design enables audience to understand highly complicated things.
‘A picture paints a thousand words’
This is very true when it comes to data visualisation. One, often simple, image can tell you the same things as lines and lines of data.
“Visualisations act as a campfire around which we gather to tell stories”
Images are an international language, allowing things to be understood universally and across large periods of time. Cave paintings show this well, as they are still understood to an extent now.
Hieroglyhics and logograms are another form of this, creating a language out of symbols and icons. Examples of this are seen in ancient Egypt and current day emojis, showing how logograms have been useful in communication for thousands of years and may well continue to be in some form or another.
Semiotics are shared amongst other things across the world too, such as road signs. This constructed language without words has become universally understood. This makes symbols and logos the perfect addition to navigation systems from travel networks to museum way finding design.
“A designer knows he/she has achieved perfection not when there is nothing left to add, but when there is nothing left to take away”
Antoine de Saint-Exupéry
“ I strive for two things in design: simplicity and clarity. Great design is born of this things”
Lindon Leader
It seems that the perfect data visualisations, icons or logograms are simple, clear and universally understood. They make data more interesting and more appealing, but the balance of form and ruction is one that needs to be carefully balanced.
The colour, size and orientation of certain aspects of the infographic is a key way of differentiating one set of information from the other, or drawing your attention to a certain point.
Forensic Architecture is the perfect example of a group of people using the power of visualising data with the power of new technology to create something really incredible, engaging and potentially life changing when used as a force for good.
David Mc Candless believes that we are all suffering from information overload, and we therefore need data visualisation to allow us to find meaning a pattern within all the data.
“When you are lost in information an information map is useful”
David Mc Candless
There is so much data around us, but it needs to be worked in the right way to allow interesting things to emerge.
He explains how sight is by far the most powerful of all our senses its stands to reason that making data visual helps to make it understandable. He also shows how misleading data can be if absolute figures are used. You need relative data to show the whole picture.
He also makes the interesting point that data visualisation can be less threatening. While I also agree this is true in certain situations, it also makes the data easier to relate to and in some cases that makes it more worrying.
For example, FCB Chicago’s ‘Most Dangerous Street’ collected real time data around Chicago’s gun violence. Turning the numbers of people shot in the city each week into a beautiful instillation, allowed people to see what the numbers really meant, giving them more weight and making them harder to ignore.

This very powerful example of data visualisation – shows how data itself can be ignored or not properly comprehended but when you make it visual its much more impactful. (FCB Chicago 2020)
There are so many examples of how data visualisation can transform data into something new. This beautiful instillation makes data an interactive and tactile thing. People are able to add their own data to the graphic in real time. The result is not particularly clear or understandable but turns simple data into something beautiful and interesting. (Grabkowska 2012)

This creates a handmade data visualisation.
I think a perfect balance is struck when data becomes beautiful, intriguing but still manages to be informative. Olivia Johnson uses cross stitch to create beautiful patterns that when overlaid with labels show the gender discrimination in the workplace. She has managed to balance beauty, simplicity and a hard hitting message. Even the medium she has chosen to use makes a point. “Cross stitch, a form of art that tends to be labeled as kitsch and women’s hobby craft, was utilised to emphasise the fact that women’s labour is routinely dismissed and undervalued,” (Brewer 2020)

Giorgia Lupi took this idea a step further, by using data from three pioneering women in science – mathematician Ada Lovelace, environmentalist Rachel Carson and astronaut Mae Jemison – and translating their achievements and life stories into beautiful data visualisations that were then used to create a clothing line. She wanted to “give data a human touch, and integrate it into our daily lives in an unexpected way”. The idea of people wearing the stories of these brilliant women hidden in the patterns on their clothing is absolutely fantastic and inspiring. (& Other Stories 2019)


A simple but powerful approach are these Meltdown Flags – taking something so integral to a country and showing how climate change is affecting world and therefore them too. (Brewer 2020b)

I also like Nicolas Felton’s idea that data is also a creative material alongside text and image. There is so much data around us, it is almost limitless the amount of design that can be created out of it.
Infographics and data visualisations help viewers to see the true story hidden within mounds of data. As someone who is very visual and quickly bored or overwhelmed by large collections of numbers, I find them to be integral ways to understand and become interested in the story behind data. They also add a touch of empathy and humanisation to data, making it easier to grasp and often harder hitting. They are therefore, the perfect way of getting your point across and inciting change.
Week 3. Big Data. Example #03

Accept & Proceed, Moon Landings (2016) https://www.acceptandproceed.com/project/moonlandings
Clarity
Communication
Message – Story
Design – Visual Form
The design needs to be clear, compelling, simple. I will look at the data used, how it tells a story, how clear the message is.
Notes:
- beauty of it noticed first
- Role of design places very highly
- Very simple, minimal design
- Clearly shows moon landing points
- No use of colour
- Takes a while to understand
- But no additional text is needed to explain
- Context given to data
- Add interest and a story to data
The light side of the moon
I was immediately drawn to this piece of information design. The beauty of the poster is the first thing I noticed. The circles are made of shimmering shades of silver laid over a black background, and they immediately evoke the feeling of outer space. The design is very simple and monotone, at first look it is a work of art, it’s only when you look closer that the data starts to reveal itself.
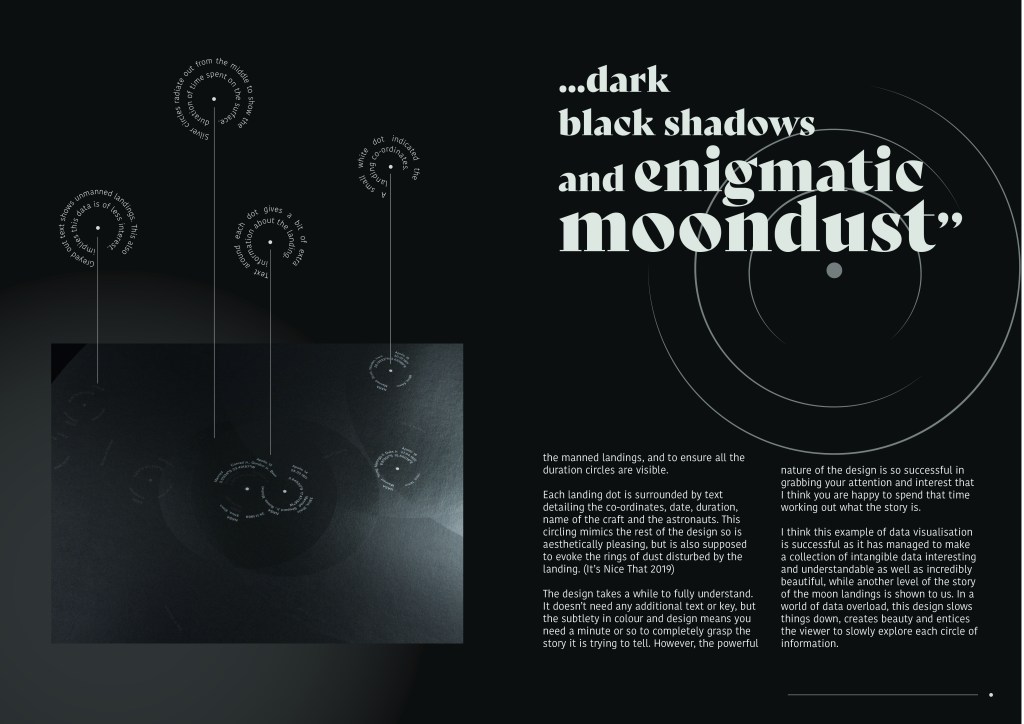
“The visual language is inspired by the iconic footage of the first human moon landing, with its incredible silver and white tones, dark black shadows and enigmatic moon-dust”
The data to be shown is the moon landings and the duration of time that the astronauts spent on the surface of the moon each time. The first moon landing has had a lot of interest, but subsequent ones are less well known, as is their relationship to each other.
The design gives meaning to the co-ordinates of the landings by placing them where they fit within a circle that represents the moon. The co-ordinates would otherwise be very hard to understand and imagine, but turning them into visual points on a circles gives them meaning and allows the viewer to instantly understand them and appreciate their relationship. This gives the co-ordinate data more solidity and allows you to build more of an attachment to the data, humanising it.
The design also shares an interesting and previously unknown story to me. Each point is surrounded by a circle that radiates out showing how long the astronauts spent on the surface of the moon on each landing. The circles overlay each other, but due to the opacity of them all are still visible, and therefore it is still clear what each represents. The simple use of circles allows clear and quick comparison between the duration of time spent. The use of circles and how they intersect is reminiscent of a tradition Venn diagram, but in this design they work together to create a beautiful pattern instead of simply showing information.
No additional colour is used in the design, as in many other infographics or data visualisations, as there is no part of the data that needs to stand out amongst the rest. The design is not trying to make a point like others such as Florence Nightingale’s, but simply tell a story of the moon landings and give a deeper insight into them. Instead, the designers have used subtle changes in tone to differentiate the unmanned landings from the manned landings, and to ensure all the duration circles are visible.
Each landing dot is surrounded by text detailing the co-ordinates, date, duration, name of the craft and the astronauts. This circling mimics the rest of the design so is aesthetically pleasing, but is also supposed to evoke the rings of dust disturbed by the landing. (It’s Nice That 2019)
The design takes a while to fully understand. It doesn’t need any additional text or key, but the subtlety in colour and design means you need a minute or so to completely grasp the story it is trying to tell. However, the powerful nature of the design is so successful in grabbing your attention and interest that I think you are happy to spend that time working out what the story is.
I think this example of data visualisation is successful as it has managed to make a collection of intangible data interesting and understandable as well as incredibly beautiful, while another level of the story of the moon landings is shown to us. In a world of data overload, this design slows things down, creates beauty and entices the viewer to slowly explore each circle of information.
Editorial design
To create my editorial design this week I wanted to keep within the style of the data visualisation design, using the dark shades and silverly whites within my design.

I also wanted to keep the circles going in my design, therefore choosing a curved font. I liked this one in particular as the centre of the ‘o’ is tilted, really drawing your eye into that letter and therefore carrying on the theme of circles. The chunkiness of the font also means the dots above the i and full stops are very obvious and circular.


Instead of using full black and white, I have used slightly soften tones of both to allow the images of the original design to fit well within the design. I pulled out the landing dots to use within the design.
After posting to the ideas wall, I tried to develop my design further. I added in some more circles and changed my annotations to reflect the text within the image, to better integrate the design and poster together. I added some gradients through the black to soften and unify it. The circle graphic I used reflects the text around each landing point. This was originally designed to look like the moon dust that was disturbed during landing, so I wanted to take this idea and bring it through the editorial with the circles of moon dust rippling out on each page.


Reflection
I really enjoyed looking into data visualisation this week. Data itself can be overwhelming, unclear and at times easy to ignore, but when it is carefully designed into an infographic or data visualisation it becomes accessible, clear and often much more impactful. We often need a visual comparison to comprehend complex data, and it is this understanding that can then incite change, emotion or intrigue. From the examples looked at this week I found myself very drawn to the examples that used data not only to tell a story, but also to create something beautiful. I was also drawn to the work that tried to send a powerful message and the idea of data bias and lack of data being as powerful as the data itself.
I chose to analyse the Moon Landings poster this week as I was drawn to its beauty and mystery. It wasn’t the clearest data visualisation of the selection, but one that required you to work a little to understand. In my eyes however, its beauty and intrigue more than make up for its more complex nature. As my final editorial I chose to show my analysis as a magazine article. In my design I wanted to reflect the colours and forms of the poster and ensure my editorial spread looked as crisp and un-cluttered as the poster itself.
Reference list
& OTHER STORIES. 2019. “& Other Stories – Giorgia Lupi Co-Lab.” & Other Stories [online]. Available at: https://www.stories.com/en_gbp/giorgialupi.html [accessed 10 Feb 2021].
BREWER, Jenny. 2020a. “Women’s Work Uses Cross-Stitched Data Visualisations to Explore Discrimination in the Workforce.” http://www.itsnicethat.com [online]. Available at: https://www.itsnicethat.com/news/olivia-johnson-womens-work-cross-stitch-data-visualisation-illustration-240820 [accessed 10 Feb 2021].
BREWER, Jenny. 2020b. “Meltdown Flags Reduces the White Space in National Flags to Reflect Their Country’s Disappearing Glaciers.” http://www.itsnicethat.com [online]. Available at: https://www.itsnicethat.com/news/meltdown-flags-graphic-design-111120 [accessed 10 Feb 2021].
CHENG, Joanne. 2014. “Analyzing Minard’s Visualization of Napoleon’s 1812 March.” thoughtbot [online]. Available at: https://thoughtbot.com/blog/analyzing-minards-visualization-of-napoleons-1812-march [accessed 10 Feb 2021].
FCB CHICAGO. 2020. “Most Dangerous Street | FCB Chicago | Illinois Council against Handgun Violence | D&AD Awards 2020 Pencil Winner | Installation Design | D&AD.” http://www.dandad.org [online]. Available at: https://www.dandad.org/awards/professional/2020/233083/most-dangerous-street/ [accessed 10 Feb 2021].
FELTON, Nicholas. 2016. “Transforming Data into Meaningful Stories | the Conference 2015.” YouTube. Available at: https://www.youtube.com/watch?v=bVEIMtpARPI [accessed 7 Feb 2021].
GRABKOWSKA, Dorota. 2012. “WHAT MADE ME Interactive Public Installation.” Behance [online]. Available at: https://www.behance.net/gallery/4419469/WHAT-MADE-ME-Interactive-Public-Installation [accessed 10 Feb 2021].
INFORMATION IS BEAUTIFUL. 2021. “Information Is Beautiful.” Information is Beautiful [online]. Available at: https://informationisbeautiful.net.
INTERACTION DESIGN FOUNDATION. 2016. “Information Visualization – a Brief Pre-20th Century History.” The Interaction Design Foundation [online]. Available at: https://www.interaction-design.org/literature/article/information-visualization-a-brief-pre-20th-century-history [accessed 10 Feb 2021].
IT’S NICE THAT. 2019. “Matthew Jones Gives Insight into Accept & Proceed’s Work for Nasa.” http://www.itsnicethat.com [online]. Available at: https://www.itsnicethat.com/articles/nicer-tuesdays-2019-accept-and-proceed-graphic-design-140619 [accessed 10 Feb 2021].
MCCANDLESS, David. 2010. “The Beauty of Data Visualization.” http://www.ted.com [online]. Available at: https://www.ted.com/talks/david_mccandless_the_beauty_of_data_visualization?nolanguage%3Den%2529 [accessed 10 Feb 2021].
MCCANDLESS, David. 2008. Information Is Beautiful. London: William Collins.

Leave a comment